Integrity Monitor Map 2D view
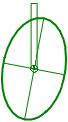
The Integrity Monitor Map 2D view displays for all points or stations the current displacements from the known position in graphical form. For each point or station, it displays the input position and, as soon as it is available, the position estimated by the parent module. Error ellipses and height bars indicate the 3-s error; the difference between the estimated and the input position is shown by a solid line and height bar. A triangle indicates the point or station that serves as reference. A grid and a reference scale roughly visualize the scale of the map.  How to navigate the map is described here.
Use these options and keyboard combinations to change what is displayed in the 2D map views.
Panning the view
To shift a different area of the screen to the center of the view do the following:
- Click and drag the mouse wheel (or middle mouse button).
Tip - When using a laptop without a mouse, press and hold both the left-click and right-click buttons while moving the cursor.
Zooming in
To display a smaller area of the map, in more detail, do the following:
- Click in a view, and roll the mouse wheel forward.
Zooming out
To display a larger area of the map view, in less detail, do the following:
- Click in a view, and roll the mouse wheel backwards.
Zooming into a certain area
To display the data within a box you draw in the view do the following:
- Keep [Ctrl]+[Alt] pressed, and click and drag around an area.
Zooming to the extents of your data
To zoom to the limits of your visible data do the following:
- Double-click the mouse wheel (or middle mouse button).
Changing the scale of a graphical element
To display the graphical elements representing errors and displacements in another scale than the default scale do the following:
- Right click into an empty area of the map and select the shortcut menu command Properties. Edit the scale settings.
The colors of graphical elements
The Integrity Monitor module uses colors to display the status of points or stations in its module view. To view an assignment of colors to states click here.
The Integrity Monitor module uses colors to display the status of points and stations in its module view. If no data is available for a point/station, the respective point/station icon is red. With displacements below the limits, the point/station icon is green. If the computed 3-s error for GNSS data is higher than its limit, displacements are not reliable. In this case, the error ellipse, displacement indicators, and station marks in the map are gray for the respective station; its status icon in the Current Displacements list is also gray. If the processor triggers a warning alarm, the point/station icon and the position and height displacement indicator of the respective point/station are colored yellow. With an alert alarm, their color is red.
See the table for how the Integrity Monitor module applies colors for the display of the points and stations in its maps as well as for the status icon and value coloring in its list of current displacements.
Object
|
Color
|
Description
|
Point/Station marker
|
Red circle
|
Map only: No processed data available for position estimation. Typically for missing targets.
|
Point/Station marker
|
Green circle
|
Map only: Result available.
|
Point/Station
|
Blue triangle
|
Point/station held fixed.
|
|
Gray
|
With GNSS data: The three-dimensional error is higher than the limit specified in the Integrity Monitor properties. The estimated positions may not be reliable.
|
|
Green
|
Estimated positions are better than the specified limits for the three-dimensional error and any of the displacements.
|
|
Yellow
|
The difference to one or more of the coordinates of the control coordinates is higher than the respective warning limit specified in the module properties.
For GNSS Data only: When yellow, the estimated positions are not considered reliable, that is the three-dimensional error is below the disarming threshold.
|
|
Red
|
The difference to one or more of the coordinates of the control coordinates is higher than the respective alert limit specified in the module properties.
For GNSS Data only: When red, the estimated positions are reliable, that is the three-dimensional error is below the disarming threshold.
|
The graphical symbols and their properties
To view the detailed description of the graphical elements click here.
Symbol
|
Description
|
Display option
|
Scale configurable
|

|
Fixed point / station, serves as reference for position differences: blue triangle with center dot.
|
Always displayed.
|
No
|

|
Input (known) position of the point or station, not fixed.
|
Always displayed.
|
No
|

|
Projection into plane of the 3D displacement, that means the deviation of the measured position from the input position: thin solid line beginning at the point or station, ending with a cross.
|
Setting to toggle the display:
Show 3D displacement.
|
Yes. If the value of the 3D displacement is larger than the maximum the scale allows, the tip of the thin line gets the form of an arrow.
|

|
Measured height displacement: a medium, solid line beginning at a point or station and pointing up/down (positive/negative value).
|
Setting to toggle the display:
Show height displacement.
|
Yes. If the value of the height displacement is larger than the maximum the scale allows, the tip of the thin line gets the form of an arrow.
|
|
An error ellipse and an error height bar indicate the 3-s error in plane (2D) and height at the input position.
|
Settings to toggle the display:
Show error height; Show error ellipse.
|
Yes
|

|
For a point, a thin solid line represents the distance between total station and target. For GNSS data, it represents a baseline between two stations.
|
Always displayed.
|
No
|
By left-clicking at any of the graphical elements you select it and can view their properties, if the Properties view is open. If you hit more than one element with the cursor, a shortcut menu appears and lets you select one of the elements. Right-clicking into the view opens the shortcut menu with the Properties command, which opens the Properties view.
Tip - To open the Properties view with the settings of an element, first left-click the element, then right-click and select Properties from the shortcut menu.
To view a table of the selectable properties, click here.
Symbol
|
Available properties
|
|
Name of point or station and its fixed status; known position in Northing, Easting, height or geographical coordinates.
|
|
- Point or station name;
- 3D displacements: Differences in 3D, 2D (plane), and all directions (North, East, height).
|
|
- Point or station name;
- Height displacement: Difference in height.
|
|
- Point or station name;
- Error ellipse values: Major axis, minor axis, azimuth;
- 3-s standard deviation in height.
|
|
- Measurement to point;
- Measurement from point;
- Stations used to compute the baseline..
|
Layers in the map
The graphical elements of the map are organized in layers. Select the map information according to your needs by toggling the display of layers.
To do so, do the following:
- Right-click into the background of any map. Make sure not to click one of the graphical elements of the map.
- Select the Properties shortcut menu command. The Properties view displays the Map2D Layer category.
- Select the setting referring to the appropriate layer and toggle its activation status: Yes enables showing the graphical elements connected with this layer, No disables their display.
Scales in the map
The map display distinguishes between distances, points and stations, and measurements.
- The baselines and the connections between total stations and the aimed targets are displayed as distance lines.
- Error ellipse, error height, 3D displacement and height displacement are measurements.
- The location of a point or a station is displayed with a scale-independent graphical symbol.
For measurements, the map uses a different scale than for distances. The reason for this is that the typical measurement value ranges from sub-millimeter level up to several centimeters, while distances and baselines may extend to kilometers.
The distance and baseline scale is displayed in the legend of the map and can be changed by zooming the map.
The measurement scale, however, is not subject to zooming, thus keeping the display of all maps in a system comparable to each other. For more information on how to influence the size of the graphical elements of the measurements click here.
To influence the screen size of the points in all maps in the system in one step, do the following:
- Right-click into the background of any map. Make sure not to click one of the graphical elements of the map.
- Select the Properties shortcut menu command. The Properties view displays the Measurement Scale category.
- Set Scale begins at to the smallest of measurement values you expect (default value for Terrestrial and Integrated Survey Engines: 0,001 m, for GNSS Engines: 0,005 m).
- Set Scale ends at to the largest of measurement values you expect (default value for Terrestrial Engines: 0,1 m, for GNSS and Integrated Survey Engines: 0,3 m).
The map then displays measurements below the start value of the scale with the smallest possible drawing size and displays measurements above the end value of the scale with the largest possible drawing size.
Note - If the value of the 3D displacement exceeds the scale, an arrow appears at its tip instead of the usual cross.
In between the maximum and minimum of the scale, the map scales the graphical elements of the measurements according to their values. Effectively, with these two settings you set the focus to the range of values you want to observe and compare.
In order to keep all map displays comparable to each other, the smallest and largest possible drawing size on the screen are determined by the system and cannot be changed. The possible drawing sizes depend, for example, on the screen resolution.